![]()
Chief Executive, Noise Solution CIC
Glenister – Transform Issue 1 pdf
Abstract
Community music literature has often been critical of the lack of rigorous evaluative evidence of projects working with youth in challenging circumstances (YICC). This paper aims to start to address this gap by applying statistical analysis to data from the Warwick-Edinburgh Mental Well-being Scale (WEMWBS). This was completed by participants before and after a ten-week music mentoring programme, the highlights of which were digitally captured, shared and commented on weekly by family and professional keyworkers. Thirty-five sets of participant scores were analysed using SPSS software. The analysis showed a high degree of statistical significance in increased well-being scores (p = 0.000078). The range of change in well-being was reported as moderate, bordering on high (r = 0.472). Demographically, the 16–25 age group reported higher increases than other age groups, while the increase in the mean score of female participants was twice as high as male participants.
Keywords: youth engagement, music mentoring, well-being, WEMWBS, at-risk youth, marginalised youth, music technology, digital storytelling
Background
The original research reported in this paper was carried out by the author, as part of a MEd undertaken at the Education Faculty whilst a postgraduate student at Darwin College, the University of Cambridge.
Issues have previously been raised regarding the quality of evidence in the literature relating to both community music and digital storytelling with Youth in Challenging circumstances (Daykin, Moriarty, Viggiyani, & Pilkington, 2011, p. 44). For the purposes of this study I use the term ‘Youth In Challenging Circumstances’ (YICC), as this is an all-encompassing descriptor, inclusive and mindful of economic difficulties, life conditions, life circumstances and behavioural issues (Youth Music, 2016, p.24). Common criticisms point to an overreliance on qualitative evidence, exaggerated claims of efficacy and shortcomings in the methodological rigour of evaluations. This is especially so around community music projects with YICC (Deane, Holford, Hunter, & Mullen, 2015, p. 133; McLellan, Galton, & Walberg, 2015).
Given the proliferation of literature citing improvements in well-being leading to increases in positive engagement, health, engagement and educational outcomes (Cabinet Office/National Well-being, 2013; Gutman & Vorhaus, 2012; Howell et al., 2007; Veenhoven, 2008) well-being could be said to lend itself to being an appropriate metric for measuring impacts on YICC. In 2016 an independent report conducted by The Social Investment Consultancy and funded by the UK Cabinet Office investigated well-being increases of Noise Solution participants. The report drew on a sample size of 34 participants finding a high level of statistical significance in participants’ increased subjective well-being of p = 0.00043 (The Social Investment Consultancy, 2016).
Using a similar sample size of N = 35 this paper intends to further build on those findings and address the previously highlighted criticisms of methodology within the community music sector. There is a tacit awareness that, as the founder and director of Noise Solution, any evaluative work done by myself is open to critique of bias, hopefully this is in part balanced by the independent findings of that 2016 report, the methodologies used, and my own transparency in recognising throughout the process that my role invariably has implications on my perceptions as a researcher in relation to this work.
Breakdown of a Noise Solution intervention
The social enterprise Noise Solution receives referrals across the East of England, from statutory agencies in the mental health, education and local authority sectors. These referrals are predominantly Youth In Challenging Circumstances (YICC), YICC being an all-encompassing descriptor, indicative and mindful of economic difficulties, life conditions, life circumstances and behavioural issues (Youth Music, 2016, p. 24). Noise Solution pairs a YICC with what researchers such as the eminent musicologist Lucy Green would call an informal musician: a musician (or music technologist) who, rather than following more traditional music education routes, has learned by ‘encountering unsought learning experiences through enculturation in the musical environment’ (Green, 2002, p.16). Focusing on participants’ musical interests, the programme uses project-based tutoring, one-to-one, and is often centred around the use of music technology and beat making.
Typically, ‘What You Hear Is What You Get’ (WYHIWYG) user interfaces are employed. WYHIWYG is an acronym used to describe musical software (commonly referred to as DAWs or digital audio workstations) that enable intuitive manipulation of information, correlating directly to changes in sound. This computer technology is intended to act as a democratising agent in this context where
students with limited skills in the traditional (formal) instruments of band and orchestra, who may or may not be able to read standard notation, are given the opportunity to be creative with the entire sonic palette of the music universe at their beck and call through computers, electronic instruments and software. (Williams, 2011, p. 143)
Following each session, a digital story created by the musician and participant, comprising highlights, is created. Noise Solution’s practice of capturing and sharing these ‘musical journeys’ has many synergies with a practice called digital storytelling. Arising in the 1990s with its initial roots in performance theatre (Lambert, 2010), digital storytelling now finds itself growing into ‘a grassroots movement that uses multi-media digital tools to help ordinary people tell their own “true stories” ’ (Davis & Weinshenker, 2012 , p. 1).
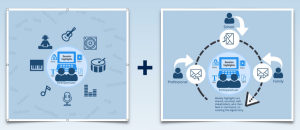
The digital stories created in Noise Solution sessions encompass text transcriptions of things said, audio, photos and video, all highlighting and reflecting moments of achievement. Participants identify which stakeholders they wish to share their digital stories with. Typical stakeholders are family, caregivers, school staff or referring professionals. With the participant’s permission, the digital narrative is distributed via a password-protected email link to stakeholders. Stakeholders’ communication is a two-way affair. This is illustrated in the right-hand box in figure 1, where arrows denote comments being posted in the digital story by stakeholders, to be viewed within the next session with the participant.
Fig. 1. Creation and distribution ofthe digital narrative. Noise Solution. (2017). E-Brochure 2017.
This cycle of music mentoring, the capturing of session highlights and the sharing and receiving of feedback occurs initially within participants’ homes over five weeks (two hours a week). Sessions are then moved to a geographically appropriate recording studio for a further five weeks (also two hours a week).
Sample
Between October 2015 and November 2016, Noise Solution received a total of eighty-two referrals. However, there were some qualifying criteria that needed addressing before inclusion in the WEMWBS sample. WEMWBS data are bivariate, meaning that, to be included, both start and end data need to be collated. A total of 70.7% of referrals completed the ten-week intervention. Others were excluded from the sample because they completed their ten sessions but failed to complete the WEMWBS questionnaire; some were under 13 (and as such ineligible for inclusion in the WEMWBS sample, validated only down to the age of 13), while some started but opted not to continue engagement. Table 1 gives a breakdown of the descriptive statistics pertaining to the remaining sample of N = 35.
Table 1. Descriptive qualitative data for WEMWBS.
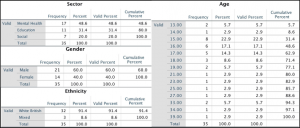
Regarding descriptive statistics within the sample, there was a 60% to 40% split in favour of male participants, age range spanning from 13 to 39. The majority of participants (62.9%) were between 15 and 18 years of age. Of those left within the sample, 48.6% were referred by mental health services, 31.4% by referrals from education sources and 20% from social service organisations.
Methods and analysis
Developed in partnership with the NHS and Warwick and Edinburgh Universities, WEMWBS is a validated, Likert-based, 14-item scale, producing scores spanning from 14 to 70. It has been used by the British government in multiple instances across the UK, with varying sample sizes sometimes exceeding 20,000. It provides a national average well-being score with which to benchmark WEMWBS results (Taggart, Stewart-Brown, & Parkinson, 2015). WEMWBS questionnaires were completed as multiple choice (via tablet or computer) in participants’ first and last sessions.
Procedural methodology relating to the analysis of the WEMWBS start and end data predominantly draws on three sources: Hawkins’ five-step statistical methodology (Hawkins, 2009, p.172), Creswell’s discussions around appropriate null hypothesis wording (Creswell, 2014, p. 191) and Field’s discussions of appropriate inferential statistical equations (Field, 2009, p. 540). Hawkins’ methodology sets out the following stages:
1) Start from a position stating a null hypothesis. For this paper the null hypothesis is:
‘There is no significant difference in participants’ WEMWBS summed start and end scores, following a ten-week intervention with Noise Solution.’
2) If found to be untrue, state an alternative hypothesis, where:
‘There is a significant difference in participants’ WEMWBS summed start and end scores, following a ten-week intervention with Noise Solution.’
3) Choose a critical significance level to work to.
Psychological and educational convention puts this at a level of p = .05 (p = probability) indicating a 95% confidence level or higher. Results are required to be under the p = .05 level to be considered statistically significant.
4) Choose an appropriate statistical analysis tool.
WEMWWBS use of an ordinal Likert scale, bivariate, related survey sample data indicates that an appropriate test for this data is a non-parametric Wilcoxon rank sum test (Field, 2009, p. 540), performed within the statistical analysis software SPSS (p. 552).
5) Finally, state whether the hypothesis is proven or unproven.
To avoid solely focusing on the probability of change (Sullivan & Feinn, 2012, p. 224), using Pallant’s calculation of range size, we can extrapolate from the Wilcoxon calculation results the range of change across the sample (Pallant, 2007, p. 225). To achieve this, the z number arising from the Wilcoxon analysis is divided by the square root of the number of observations. The answer will fall within the following scale between zero and one where:
r = .10 (small effect);
r = .30 (medium effect); or
r = .50 (large effect).
WEMWBS data were also sifted in groups of age, gender and bandings of percentages of low/moderate and high well-being questionnaire responses. These bandings are derived from the work of the Cheshire and Merseyside Public Health Collaborative (CHAMPS, 2013). The methodology for arriving at these boundaries involves taking a population’s median WEMWBS score and applying the standard deviation from those results, plus or minus, as a crossover point between low, moderate and high boundaries (Taggart et al., 2015, p. ii). Because our sample of 35 is small, rather than calculate from Noise Solution’s population mean, I used CHAMPS’ pre-existing banding, based on a substantially larger population, to inform the interpretation of Noise Solution participants’ data.
Findings
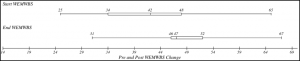
Figure 2 shows the results of analysis of WEMWBS data using SPPS software, utilising a Wilcoxon signed rank score test (Field, 2009, p. 540; Hinton et al., 2004, p. 130).
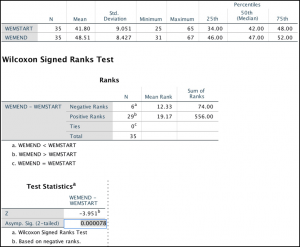
Fig. 2. Wilcoxon analysis result, within SPSS software.
The result (see figure 2) indicates that the ‘Start WEMWBS scores’ (mean rank = 12.33) was rated less favourably than the ‘End WEMWBS scores’ (mean rank = 19.17). Z = -3.951.
This gives a p figure of p = 0.000078, which is well under the critical significance level of p = .05. This allows us to reject the null hypotheses and conclude that the alternative hypothesis is true. Therefore:
There is a significant difference in participants’ WEMWBS summed start and end scores, following a ten-week intervention with Noise Solution.
The range-of-change figure results arising from the Pallant’s calculation was as follows:
z = 3.951 (result from Wilcoxon analysis) divided by square root of participant observations (√70 = 8.37); the resulting figure is r = 0.472.
Therefore, the range of change is medium but notably close to being rated as having a large effect, coming within less than .03 of being classed as a large effect size.
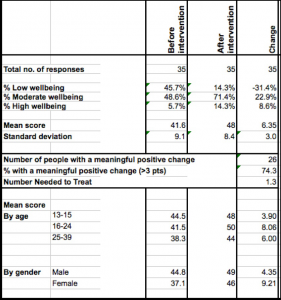
Whose results are changing the most?
The WEMWBS user guide states that WEMWBS is sensitive to change and that any change between the start and end scores greater than 3 can be considered meaningful (Taggart et al., 2015, p. 45). Table 2 shows us that overall there was a meaningful change of plus 6.35 across the sample. Looking at scores bracketed by age or gender, we see meaningful change across all categories with the highest changes occurring within the 16–25 age (plus 8.06), and a greatly increased mean score for female participants (plus 9.21), representing twice the change of the male participants’ mean score (at plus 4.35).
Table 2 Mean scores for WEMWBS, divided along gender and age lines.
Using the data from table 2 from which to extrapolate, figure 3 (below) gives a visual representation of the overall percentage of change in low, moderate and high levels of well-being bandings between pre- and post-intervention. There is a 31% drop in low well-being post-intervention, a 22.9% increase in medium well-being post intervention and an 8.6% increase in high well-being.
Fig. 3. Change in participant levels of well-being pre- and post-Noise Solution, using Cheshire and Merseyside Public Health (CHAMPS) boundaries methodology.
A box plot (aka box and whisker diagram) is a standardised way of displaying distribution of data. The central rectangles, for pre and post scores (figure 4), span the first quartile to the third quartile (the interquartile range or IQR) of the WEMWBS scores. These rectangles display where the majority of summed scores lie. The line inside the rectangle shows the median and ‘whiskers’ left, and right of each box show the minimum and maximum scores (Kirkman,1996).
Fig. 4. Box plots demonstrating the distribution of change.
There is a pronounced shift in lowest start and end scores. We also see a clear shift of the majority of scores within the rectangles of the end scores from lower well-being scores (pre-intervention) to a much more focused cluster of moderate levels of well-being (post-intervention). These majority scores are within three points of the national mean. The WEMWBS user guide places the national mean as being between 50 and 51 (Taggart et al., 2015, p. ii).
Discussion
The literature concerning informal music-making and engagement has often found that allowing students more control over their learning improves engagement (Daykin et al., 2011; Deane et al., 2015; Green, 2006; Jaffurs, 2004; Kafai, Desai, Peppler, Chiu, & Moya, 2006; Lamont & Maton, 2010; Narita & Green, 2015; Shields, 2001; Thompson, 2012; Williams, 2011). This focus on increased autonomy aligns with the findings of Taylor and Parsons’ 2011 study ‘Improving Student Engagement’. Drawing on examples of student engagement in ‘academic, cognitive, intellectual, emotional, behavioural, social and psychological’ settings (Taylor & Parsons, 2011, p. 4), this meta-study cites five themes emerging from evidenced examples of practice worldwide: (1) moving learning from the classroom into the community, (2) technology-rich environments, (3) open—sometimes called “transparent”—learning climates; (4) ‘peer to peer’–type relationships between students and teachers and (5) teachers learning with students. There is considerable alignment with Noise Solution’s practice of informal mentoring and that practice occurring within technology-rich environments.
The implied encouragement of autonomy also aligns with another psychological theory often cited in relation to understanding the factors required to fulfill well-being. Ryan and Deci’s Self Determination Theory (SDT) is an overarching macro theorisation of the psychological needs to facilitate intrinsic and extrinsic motivation and to foster that which is needed to enable well-being to flourish (Ryan & Deci, 2000). SDT postulates that, for human beings to flourish and to achieve well-being, three psychological needs are required to be fulfilled: autonomy, competence and relatedness. If any of those needs are unfulfilled, then ill-being can occur (Ryan & Deci, 2000, p. 61).
An investigation of participants’ well-being in this context might benefit from looking to see if participants recognise these concepts of autonomy, competence and relatedness within the intervention. My own feeling is that, within the intervention, autonomy is encouraged by allowing participants to co-negotiate project goals and dictate what is shared digitally and with whom. Competency may be facilitated (mediated by technology) through achievement of goals relating to something societally perceived as complicated (creating music), while relatedness is potentially being facilitated through the digital story, enabling communication with stakeholders.
Noise Solution’s use of digital narrative also bears further investigation. Within traditional arts practice with YICC, the experimentation or performance element is fleeting and open to reinterpretation over time: it exists only in memory. This is discussed and contrast to a digital story by Davis and Weinshenker’s (2012) work on digital stories:
Once it is complete, its “‘telling” does not require the participation of the storyteller: It stands as a work of art a representation apart from the teller, an “object” for reflection and critique.” (Davis & Weinshenker, 2012, p.50)
Davis and Weinshenker (2012) suggest that the immutable nature of a digital story enables it to retain a power to influence. The process of others seeing and engaging with the narrative may cement any self-realisations the process may have engendered. In fact, they are needed to increase impact:
Without the on-going support of the community, the self-realisations they report and the personal transformations they testify to are likely to fade from consciousness without translation into action. (Davis & Weinshenker, 2012, p. 50)
Meaningful interaction with others may also help people internalise more readily the narrative they have created. Robert Kegan states further that, for self-reflection and change to occur, adults need to help scaffold experiences for young people where:
Self-reflection is a developmental accomplishment…. [T]hey must step outside of their immediate categorical reality. Their experience must be transformed into an object of contemplation. (Kegan, 1994, p. 32)
The immutable nature of the digital narrative and its ability to externalise participant experience may help facilitate YICCs’ ability to reflect and process their internal view of themselves (Cooper, 1993; Davis & Weinshenker, 2012; Kegan, 1994). It is possible that the digital stories support the building of a new perception of self that begins to challenge internally held negative perceptions. The reinforcement of these new reflections may additionally be aided through third-party validation, in the form of commentary within the digital stories. Indeed, it may also be the case that the digital story, with its ability to connect family and key workers with participants, could facilitate relatedness, a psychological need identified within SDT theory.
Conclusion and implications
The literature suggests that improvement in well-being can lead to improved educational and health outcomes (Cabinet Office/National Well-being, 2013; Gutman & Vorhaus, 2012; Howell et al., 2007; Veenhoven, 2008). In this paper music and digital stories, as an intentional mediator on impact on well-being, have been shown to deliver moderate to high, statistically significant changes in well-being. These increases in well-being that are demonstrably close to a national average provided by the wide use of the WEMWBS well-being scale and its national average score. This paper replicates findings of statistical significance from the 2016 Social Investment Consultancy report, delivered within informal environments by non-health professionals, in this case musicians/music producers. This replication of results has implications in building a case for music/arts as an intervention at policy level. At the community music sector level, this paper demonstrates why organisations might consider digital stories as an element of practice and also how those organisations might capture and present, with greater methodological rigour, the impacts of their work.
Limitations of the study and recommendations for future research
This study was focused on quantitative findings, yet at N = 35 the sample is still small, even when independently replicated. Research such as DeNora’s study of qualitative methods of studying music’s impact on well-being raises concerns around the hegemony of objective quantitative methodologies (DeNora, 2013). This is especially true when quantitative data is solely used to measure subjective issues of mental health and well-being. The digital narratives developed in Noise Solution’s practice may offer rich qualitative data with which to align and or compare with quantitative WEMWBS data such as that which this paper demonstrates.
Future research might look at a number of areas. For instance, it might investigate what role gender plays in the disparity we see in WEMWBS results between the genders. Or it might compare the quantitative evidence of increases in well-being with a qualitative analysis establishing if the psychological needs set out within Self Determination Theory (autonomy, competence and relatedness) are present in stakeholder’s qualitative data. Self-determination theory opines that the presence of all three of these factors would manifest increased well-being. Does it? And are these elements recognised as being present by stakeholders?
In terms of next steps, work is ongoing in applying the well-being data methodology in this paper and the analysis of the psychological needs highlighted in SDT within a digital platform that additionally captures and shares participants’ digital narratives. The platform is currently live and is collating participant and stakeholder data in the form of equal amounts of digital stories and WEMWBS data. Following papers will be able to draw on these larger data samples in potentially addressing these questions.
References
Cabinet Office/ National Wellbeing. (2013). Wellbeing policy and analysis. Available: https://www.gov.uk/government/publications/wellbeing-policy-and-analysis. Last accessed 9/4/17.
CHAMPS . (2013). Measuring outcomes. Available: http://www.champspublichealth.com/collaborative-service-legacy/measuring-outcomes. Last accessed 19/06/17.
Cooper, P. (1993). Exploring pupils’ perceptions of the effects of residential schooling on children with emotional and behavioural difficulties. Child and Youth Care Forum, 3(2), 41–71.
Creswell, J. (2014). Research design: qualitative, quantitative, and mixed methods (4th ed.). Los Angeles: SAGE Publications.
Davis, A., & Weinshenker, D. (2012). Digital storytelling and authoring identity.
In: C. Ching & B. Foley. (Eds.), Constructing the self in a digital world. Cambridge: Cambridge University Press.
Daykin, N., Moriarty, Y., Viggiyani, N., & Pilkington, P. (2011). Young offenders evidence review. Retrieved from http://network.youthmusic.org.uk/resources/research/young-offenders-evidence-review
Deane, K., Holford, A., Hunter, R., & Mullen, P. (2015). Power of equality 2. Retrieved from http://network.youthmusic.org.uk/learning/research/power-equality-2-final-evaluation-youth-musics-musical-inclusion-programme-2012-20
DeNora, T. (2013). ‘Time after time’: A Quali-T method for assessing music’s impact on well-being. Retrieved from https://www.ncbi.nlm.nih.gov/pmc/articles/PMC3740600
Field, A (2009). Discovering statistics using SPSS. 3rd ed. London: SAGE Publications. 1–857.
Green, L. (2002). How popular musicians learn. London: Ashgate.
Green, L. (2006). Popular music education in and for itself, and ‘other’ music: Current research in the classroom. International Journal of Music Education, 24(2), 101–118.
Gutman, L., & Vorhaus, J. (2012). The impact of pupil behaviour and wellbeing on educational outcomes. Available: https://www.gov.uk/government/publications/the-impact-of-pupil-behaviour-and-wellbeing-on-educational-outcomes. Last accessed 10/04/17.
Hallam, S. (2002). Musical motivation: Towards a model synthesising the research. Music Education Research, 4(2), 225-244.
Hawkins, D. (2009). Biomeasurement: A student’s guide to biological statistics. Oxford: Oxford University Press.
Hinton, P. R., Brownlow, C., McMurray, I., & Cozens, B. (2004). SPSS explained. London: Routledge.
Howell, R. T., Kern, M. L., & Lyubomirsky, S. (2007). Health benefits: Meta-analytically determining the impact of well-being on objective health outcomes. Health Psychology Review, 1(1), 83–136.
Jaffurs, S. (2004). The impact of informal learning practices in the classroom, or how I learned to teach from a garage band. International Journal of Music Education, 22(3), pp. 189–200.
Kafai, Y., Desai, S. Peppler, K. Chiu, G. Moya, J. (2008). Mentoring partnerships in a community technology centre: A constructionist approach for fostering equitable service learning. Mentoring and Tutoring: Partnership in Learning, 16(2), pp. 191–205.
Kegan, R. (1994). In over our heads: The mental demands of modern life. Cambridge, MA: Harvard University Press.
Kirkman, T. (1996). Statistics to use. Retrieved from
http://www.physics.csbsju.edu/stats/box2.html
Kisfalvi, V., & Oliver, D. (2015). Creating and maintaining a safe space in experiential learning. Journal of Management Education, 2015, 39 (6) 713–740
Lambert, J. (Ed.). (2010). Digital storytelling cookbook. Retrieved from https://wrd.as.uky.edu/sites/default/files/cookbook.pdf.
Lamont, A. & Maton, K. (2010). Unpopular music: Beliefs and behaviours towards music in education. In R. Wright (Ed.),Sociology and music education (pp. 63-80). Basingstoke: Ashgate.
McLellan, R., Galton, M., & Walberg, M. (2015). The impact of arts interventions on health outcomes: A survey of young adolescents accompanied by a review of the literature. Retrieved from http://www.creativitycultureeducation.org
Narita, F., & Green, L. (2015). Informal learning as a catalyst for social justice in music education. In C. Benedict, G. Schmidt, P. Spruce, & P. Woodford (Eds.), The Oxford handbook of social justice in music education (pp. 302–317). Oxford: Oxford University Press.
Noise Solution. (2017). E-Brochure 2017. Available: http://www.noisesolution.org/wp-content/uploads/2018/10/Noise-Solution-Digital-brochure-2017.pdf. Last accessed 2/10/2018.
Pallant, J. (2007). Journeys in survey research (3rd ed.). New York: Open University Press.
Ryan, R., & Deci, E. (2000). Self-determination theory and the facilitation of intrinsic motivation, social development, and well-being. American Psychologist, 55(1), 68–78.
Shields, C. (2001). Music education and mentoring as intervention for at risk urban adolescents: Their self-perceptions, opinions, and attitudes. Journal of Research in Music Education, 49(3), 273–286.
Sullivan, G. Feinn, R. (2012). Using effect size—or why the p value is not enough. Journal of Graduate Medical Education, 4(3), 279–282.
Taggart, F., Stewart-Brown, S., & Parkinson, J. (2015). WEMWBS User guide – Version 2. Retrieved from https://warwick.ac.uk/fac/med/research/platform/wemwbs/researchers/userguide/wemwbs_user_guide_jp_02.02.16.pdf
Taylor, L., & Parsons, J. (2011). Improving student engagement. Current Issues in Education, 14(1), 1–33.
The Social Investment Consultancy. (2016). Noise Solution External Evaluation Report. Available: http://www.noisesolution.org/wp-content/uploads/report-view/web/viewer.html?file=noise-solution-external-report.pdf. Last accessed 26/04/18.
Thompson, P. (2012). An empirical study into the learning practices and enculturation of DJs, turntablists, hip-hop and dance producers. Journal of Music, Technology and Education, 5(1), 43–58.
Veenhoven, R. (2008). Healthy happiness: Effects of happiness on physical health and the consequences for preventive health care. Journal of Happiness Studies, 9(3), 449–469.
Williams, D. (2011). The non-traditional music student in secondary schools in the United States: Engaging non participant students in creative music activities through technology. Journal of Music, Technology and Education, 4(3), 131–147.
Youth Music. (2016). Challenging circumstances. Retrieved from https://www.youthmusic.org.uk/what-we-do/challenging-circumstances.
Youth Music. (2016). Youth makes music: Impact report 2014-15. Retrieved from https://www.youthmusic.org.uk/impact-report.